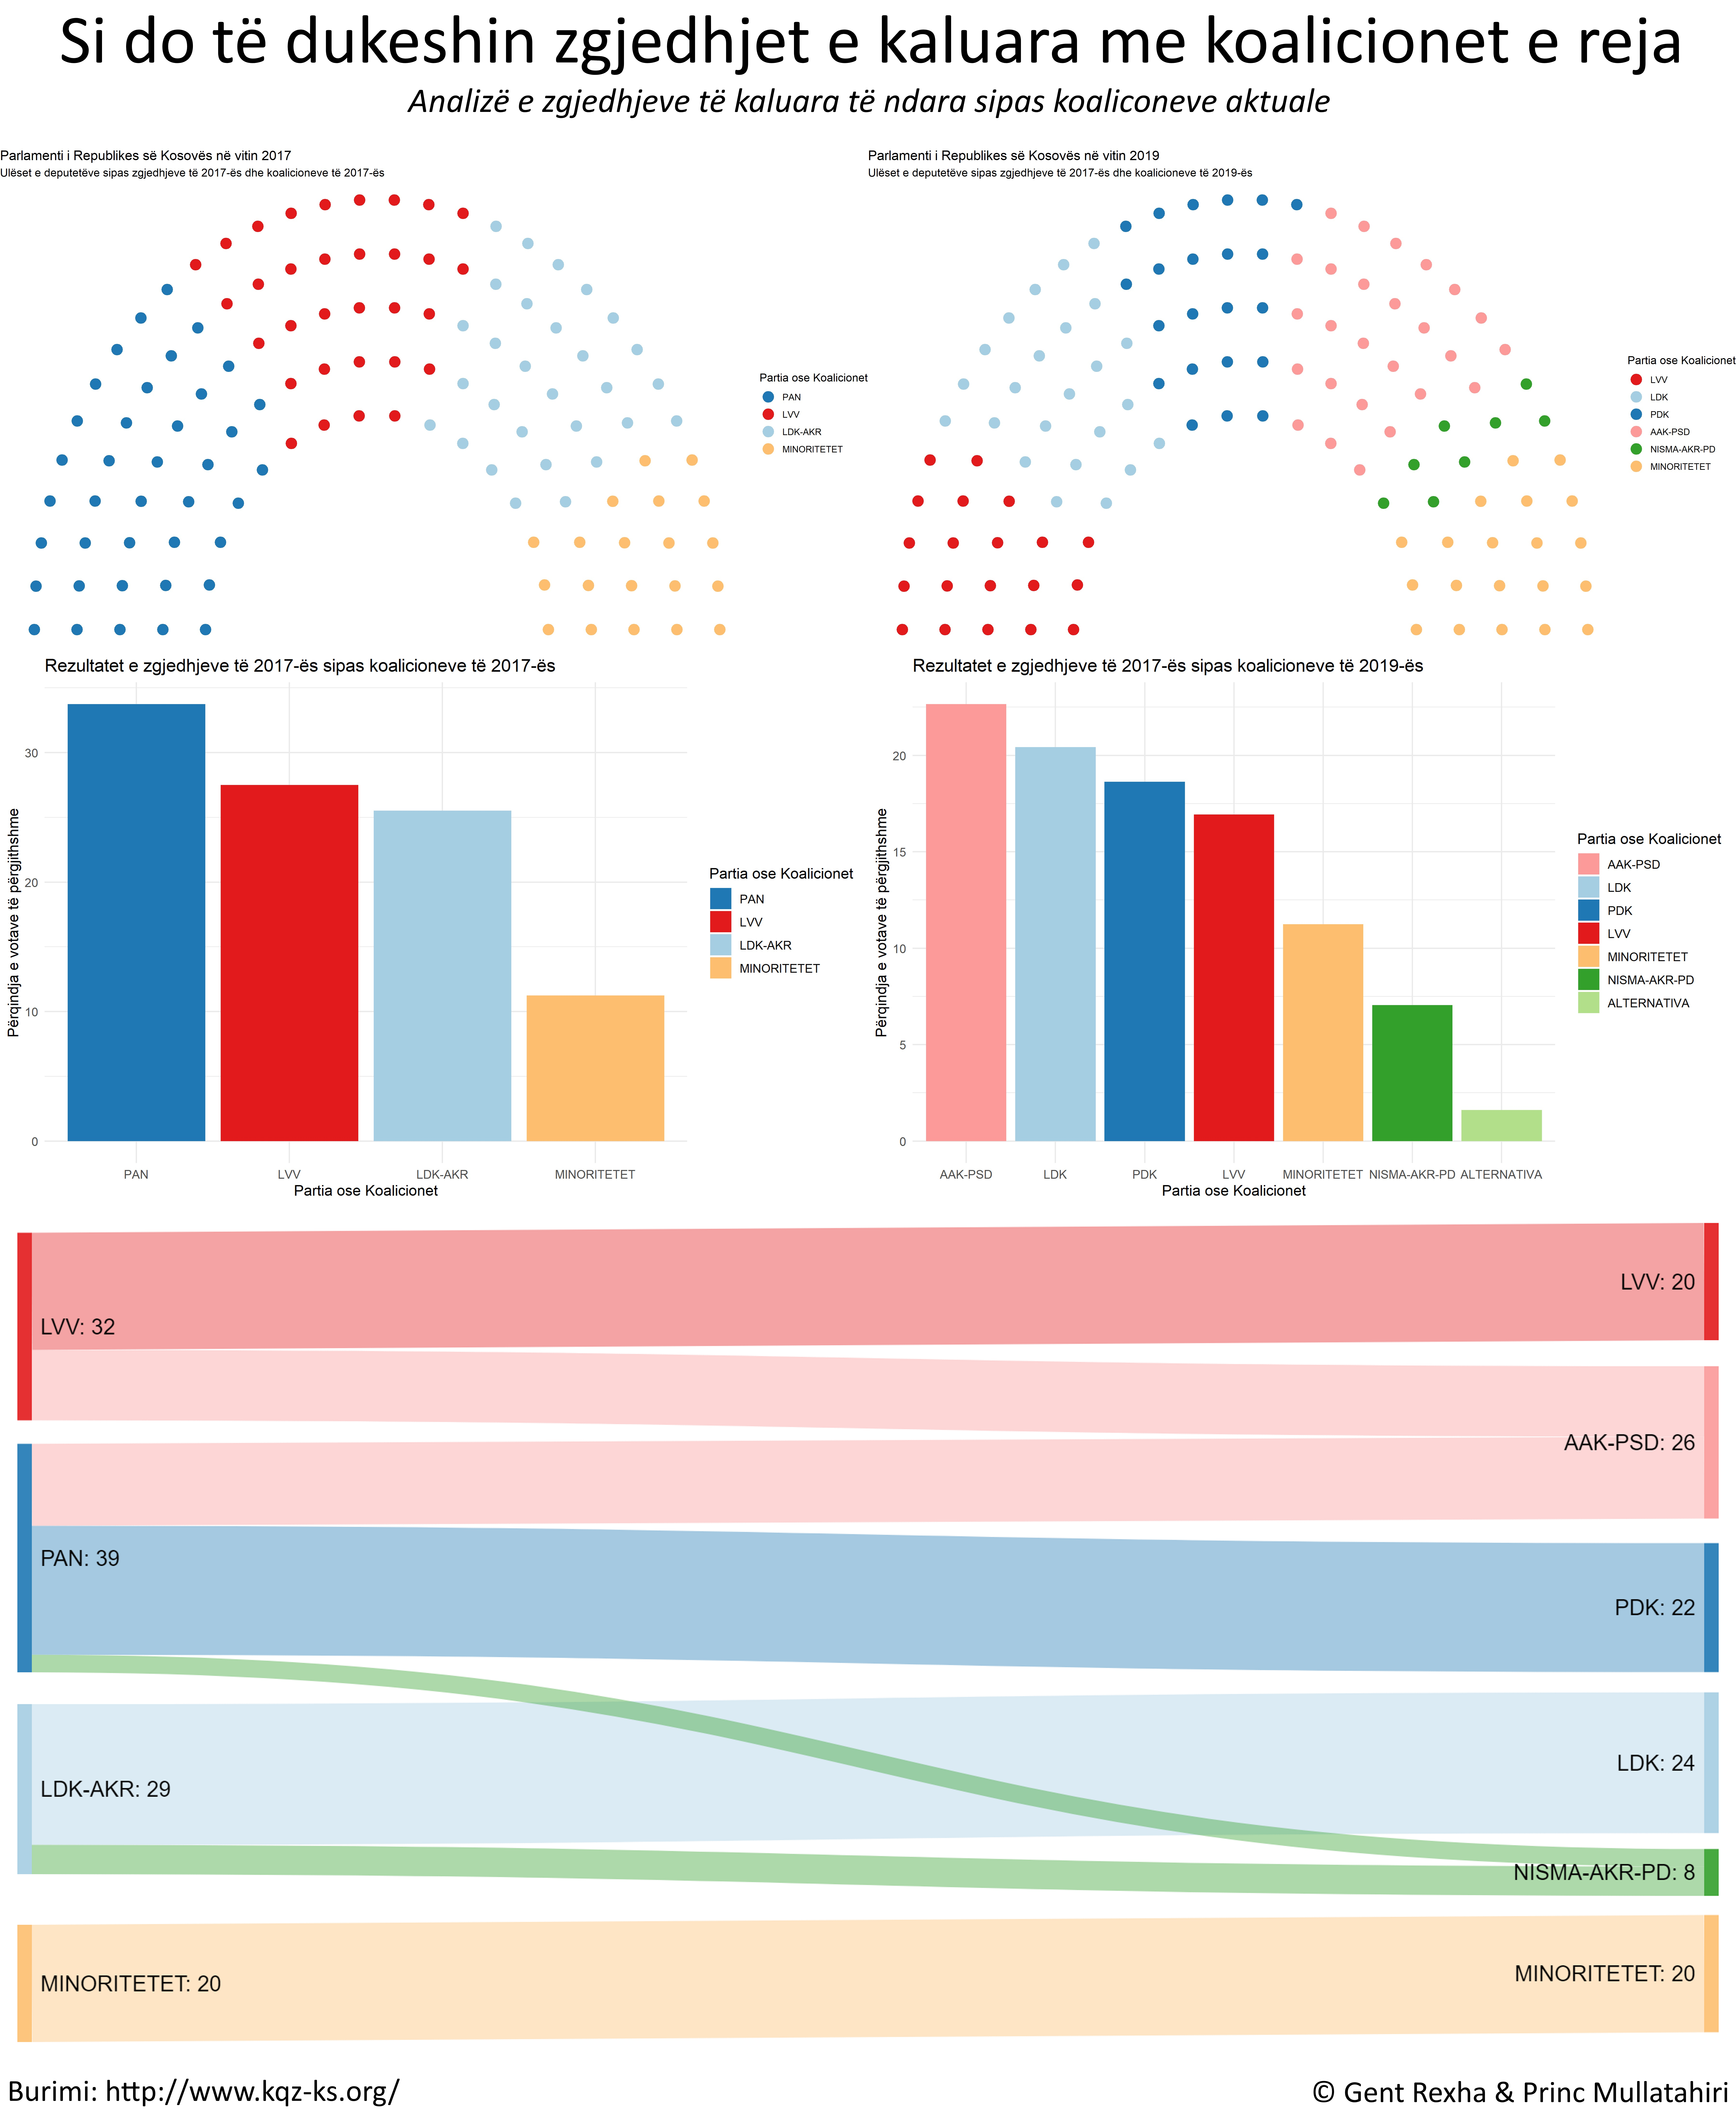
Considering the deadline for declaration of participation in the elections through a Coalition has ended for the political parties in Kosovo, we decided to analyze the impact of the newly formed coalitions. To measure that, we decided to look at the last Kosovo Assembly Elections in 2017 and apply the coalitions to those results.

On the left, the actual results are visualized. Whereas, on the right side the hypothetical “results” are shown. First, we compare seats in the parliament, as in how many seats each party or coalition got. After that, voting results are compared between parties and coalitions. In the last figure, the movement of the parliamentary seats from the coalitions of 2017 to the current ones is presented, always based on the results of 2017.
With this side-by-side analysis, it is very easy to find out the impact of the new coalitions in Kosovo’s political scene.
Our methodology to find out how much each party contributed in a coalition: the total candidate votes the coalition was split based on the candidates origin party. Therefore, finding the amount of how much each party contributed to the overall coalition candidate votes. By those contribution proportions, the coalition votes (overall) were also split.
Tools used: R Programming Languange, Excel & ofoct Online Merger